
Inventory management is a crucial aspect of business operations that impacts everything from customer satisfaction to the financial health of a company. Traditionally, many enterprises begin inventory tracking in Excel due to its availability and ease of use. According to statistics, 67.4% of supply chain managers prefer spreadsheets as a key tool for accounting.
However, it should be acknowledged that this tool also has its limitations. With the growing demands of modern commerce, these limitations are becoming increasingly evident. It becomes challenging for a growing business to ensure full visibility of all inventory and effectively control them using only Excel.
In our article, we will thoroughly examine the pros and cons of inventory management in Excel and provide recommendations for optimal use of spreadsheets. Additionally, we will propose a more rational and efficient solution for growing businesses that will help overcome all limitations of the traditional approach.
- What Is Inventory Management in Excel?
- How to Create an Inventory Management System in Excel?
- Benefits of Using Excel for Inventory Management
- Three Key Drawbacks of Inventory Management Through Spreadsheets
- Tips for Inventory Management Through Spreadsheets
- How to understand when it’s time to implement an automated inventory management system?
- Automate Inventory Management to the Fullest with Ysell.pro
- Frequently Asked Questions
What Is Inventory Management in Excel?
Inventory management in Excel is a method that enables the organization and tracking of goods inventory through electronic spreadsheets. In Excel (or Onedrive, Google Spreadsheet), you can create inventory spreadsheets, apply formulas, macros, and other useful attributes for efficient inventory management.
Possibilities of MS Excel:
- Displays inventory volumes;
- Filters and sorts data for quick search and analysis;
- Tracks deliveries;
- Generates sales reports;
- Visualizes data for better forecasting, and more.
Companies often develop their own Excel templates, leveraging the program’s flexibility to create a system that aligns with their unique inventory management requirements. Functions, formulas, and capabilities of spreadsheets can be utilized to perform calculations, generate reports, and automate certain aspects of the inventory tracking process.
In Excel, users can create multiple sheets within a workbook to organize data, such as one for current inventory levels, another for sales operations, and so forth. Managing inventory through spreadsheets is well-suited for small stores and other small businesses.
How to Create an Inventory Management System in Excel?
Spreadsheets provide a simple and effective solution for those who are just starting their business and are not yet ready to invest in more complex inventory management systems. To use them effectively, you need to know how to create an inventory spreadsheet in Excel. Let’s explore how this can be done.
Prepare a spreadsheet for the list of products
To begin using Excel for inventory tracking, you need to create a list of products in a spreadsheet. To do this, launch the Microsoft Excel program on your computer or use its online version. Select the “Create” function in the program menu or use the keyboard shortcut Ctrl + N. You will be presented with a blank canvas to create your own inventory management system.
Excel offers ready-made templates, including a basic inventory spreadsheet template.
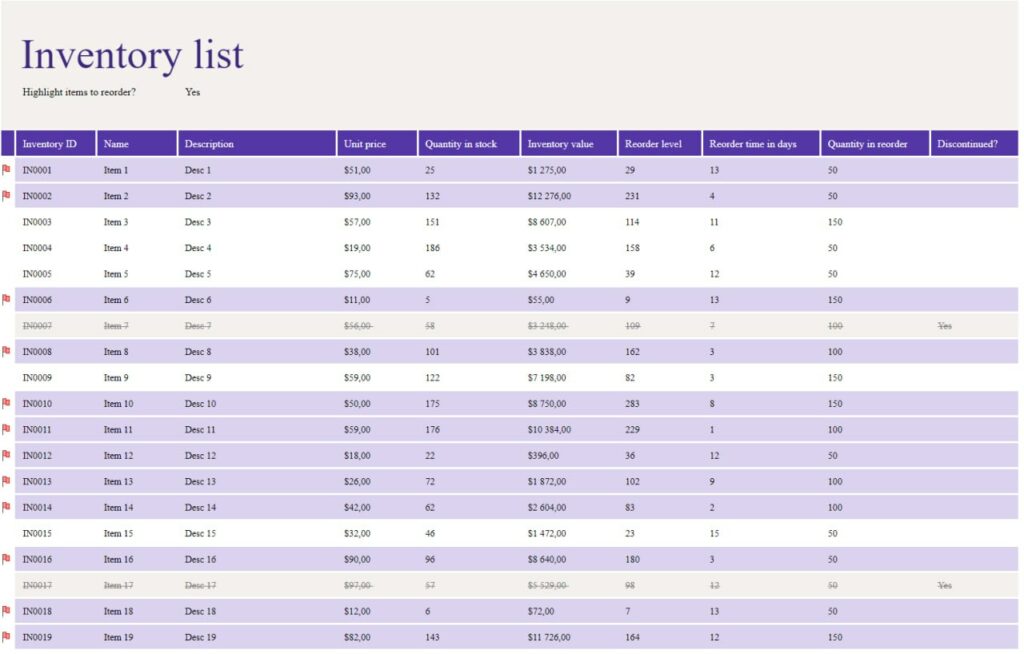
It includes the following key data:
- Product ID: A unique number or code that identifies each product in the inventory. This identifier helps prevent confusion during data entry and ensures the uniqueness of each item in the spreadsheet.
- Product name: A brief name for the product to quickly identify it in the inventory list.
- Description: Additional information about the product, which may include specifications, dimensions, colors, and other details useful for inventory management.
- Quantity in stock: The current quantity of this product available in stock. It is updated with new arrivals or sales.
- Unit price: The cost of one unit of the product. This value is used to calculate the total value of the inventory.
- Inventory value: Automatic calculation of the total value of the inventory for a specific product. It is computed by multiplying the quantity in stock by the unit price.
- Reorder level: The quantity at which it is necessary to place a new order for the product. This helps prevent shortages and ensures timely replenishment of stocks.
- Reorder time in days: The time required for processing the order and delivering new products.
- Quantity in reorder: The quantity of products that should be ordered when the reorder level is reached.
If you have specific requirements for inventory management, create your own spreadsheet. Determine which fields will be most useful for your inventory management. In addition to basic fields like product name, description, quantity, and cost, you can add other attributes specific to your business.
Enter data about current inventory levels into the spreadsheet
Once you have created the structure of the spreadsheet and added the necessary columns, it’s time to fill it in. Enter data about each of your products according to the column headers. This will provide you with a clear overview of your inventory and establish a foundation for efficient inventory management through spreadsheets.
Set up formulas and functions to automate calculations
Utilize spreadsheet functions to automate calculations and analyze data about your inventory. They will save your time and reduce the likelihood of errors in accounting. Here are examples of basic formulas that you might find useful:
- SUM: Formula for calculating the total quantity of products in stock. Enter the range of cells you want to sum in parentheses. Excel will automatically sum all values in the specified range. For example, to sum the data in column C, it would look like this: =SUM(C2:C100).
- FIND: Formula for locating the position of text within a cell or range of cells. It can be used for quick search and identification of specific products or categories in your inventory. For example, if you want to find “electronics” in cell B2, the formula would look like this: =FIND(“electronics”, B2).
- SORT: Formula for sorting data in Excel. For instance, if you have a column A with product names and want to sort it alphabetically, the formula would look like this: =SORT(A2:A100, 1, 1). Here, A2:A100 is the range of cells to sort, 1 is the column number (in this case, the “Product Name” column), and 1 is the sort order (1 for ascending, -1 for descending).
Regularly update the data in the spreadsheet
Maintain the accuracy of information, track changes in inventory, and make adjustments to the spreadsheet as needed. This approach will help you make the most effective using Excel for inventory management and provide an accurate foundation for decision-making.
Benefits of Using Excel for Inventory Management
Spreadsheets provide entrepreneurs and small businesses with a flexible solution without the need to invest in complex inventory management systems. Here are several key advantages of using Excel for organizing warehouse accounting:
Accessibility
Excel comes pre-installed on most computers, eliminating the need to purchase additional software. This makes it an accessible tool for inventory management. Particularly for small companies looking to save on expenses, Excel serves as a readily available and cost-effective solution.
Ease of use
Excel is a simple and intuitive program that many users are familiar with. Creating spreadsheets and entering data into them does not require special skills or training. This makes Excel accessible to all employees, even those who do not have experience with inventory management.
Flexibility and customizability
Excel provides the capability to create spreadsheets and format them according to the needs of your business. You can add columns for various inventory categories, such as SKU, description, quantity in stock, and others. Additionally, you can include formulas and calculations to automate certain processes of counting and inventory tracking in Excel.
Three Key Drawbacks of Inventory Management Through Spreadsheets
As your company experiences an increase in trade volume, you may encounter limitations in using Excel, impacting operational efficiency and, consequently, the ultimate profitability. Often, employees become accustomed to using Excel without realizing how these limitations start affecting their work.
Limited accessibility
One significant drawback of using Excel for inventory management is its limited accessibility and collaboration capabilities. Spreadsheets are often stored locally or shared via email. Simultaneous access by multiple users can lead to version control issues. In scenarios where real-time collaboration and access are crucial, Excel limitations may impede the efficiency of warehouse operations. This can result in delays, especially when multiple team members need to update or retrieve information simultaneously.
It’s worth noting that today, companies often prefer using Excel spreadsheets on platforms like OneDrive or Google Spreadsheet. These platforms enable data storage and processing in the cloud, allowing multiple users to collaborate on a document in real-time.
Increased error potential
While Excel is a powerful tool, it is susceptible to human errors during data input and manipulation. In a rapidly changing warehouse environment where large volumes of products are constantly moving, manual input errors can occur frequently. These errors may lead to discrepancies in inventory levels, misrepresented product information, and incorrectly calculated financial metrics. Over time, such inaccuracies can impact decision-making processes and overall operational efficiency. Even a small mistake can ultimately result in profit loss.
Delayed data updates
In Excel, there is a lack of real-time automatic data updating capabilities. As a result, inventory data remains current only after the last manual update of the Excel file. In a dynamic warehouse environment with frequent inventory movements, this delay can lead to the presence of outdated information. This can have a negative impact on decision-making and may result in shortages or excess inventory due to the reliance on potentially outdated data.
Tips for Inventory Management Through Spreadsheets
Whether it’s a small startup or a large corporation, maintaining accurate and organized inventory management is crucial for optimizing operations and achieving financial success. To make the most of Excel spreadsheets and ensure their effectiveness, it’s important to follow proven methods. Below, we’ve provided practical tips for inventory management through Excel for better control, accuracy, and understanding of your inventory levels.
Ensure daily data monitoring
Conduct daily data checks in your inventory spreadsheet to minimize errors and discrepancies. Implement automated Excel control tools and involve your staff in the daily verification and updating of data. This approach allows you to maintain high accuracy and efficiency in inventory management.
Timely update order changes in the spreadsheet
Ensure that every team member handling orders promptly updates the electronic spreadsheet, minimizing delays and inaccuracies. This practice guarantees real-time data accuracy and enables timely responses to changes in orders, helping avoid product losses due to insufficient control. Consistent and immediate updates contribute to a more efficient and reliable inventory management process.
Utilize cloud technologies
Utilize Excel spreadsheets in the cloud, such as OneDrive or Google Spreadsheets. This provides access from any device and enables collaborative work among team members. By doing so, you can minimize delays and ensure the timeliness of data, as any updates to the Excel file are immediately visible to all participants. Cloud technologies also offer secure data storage and automatic backup, reducing the risks of data loss.
Consolidate data into a pivot table monthly
Effective inventory management requires not only daily control but also systematic analysis. To achieve this, we recommend consolidating data and creating a pivot table in Excel on a monthly and quarterly basis. This process will enable you to comprehensively assess sales dynamics, seasonal fluctuations, and the efficiency of inventory management.
Regularly analyze the data entered into the spreadsheet
Periodically review all data in the spreadsheet to identify and rectify potential errors, as well as update outdated or incomplete information. This additional effort will help ensure data accuracy and prevent potential distortions in calculations.
Visualize data using charts
Create charts and reports in Excel to visualize trends in inventory data, turnover rates, and other key performance indicators. Graphical representation of data will facilitate understanding of dynamic changes, identify important trends, and make analytics more accessible for the entire team.
Monitor the need for updating the inventory management system
Excel provides powerful tools for inventory accounting, data management, and report creation, but only for a small volume of inventory. As your business grows, there will be needs better addressed by specialized inventory management software. You should be able to recognize the moment when there is a necessity to transition to more sophisticated software solutions.
How to understand when it’s time to implement an automated inventory management system?
With business growth comes the emergence of new sales points, an increase in inventory volume, and a higher number of suppliers. Managing business operations becomes more complex. As a result, warehouse efficiency declines, impacting the company’s profitability. An automated inventory management system, capable of handling large volumes of data and providing real-time monitoring and control, becomes a necessity.
Here are a few key points to help you quickly recognize this need and timely update your management system:
- The product matrix has exceeded 1000 SKUs.
- There is a need to consider more product characteristics when replenishing inventory, such as seasonality, expiration dates, promotions, packaging, order multiples, delivery schedules, and other factors.
- You are facing a situation where some products are in surplus, while others are experiencing shortages.
- You find it challenging to determine key warehouse performance indicators, such as inventory turnover rate, picking accuracy, or overall inventory cost.
- Purchasing department staff are consistently overwhelmed and frequently make errors in orders.
- Your demand forecasts are not sufficiently accurate: there is an excess of expensive items with low demand in the warehouse, while high-demand products are unavailable.
If you have noticed these signs in the operation of your warehouse, it’s time to consider implementing a robust inventory management system.
Automate Inventory Management to the Fullest with Ysell.pro
As we have emphasized, and more than once, Excel can be a useful tool but only in the initial stages of your operations. As your business grows and the complexities of inventory management needs increase, spreadsheets become an inefficient and insufficient tool.
Ysell.pro is an innovative cloud-based software specifically designed for maximum automation of warehouse processes. The system offers more advanced features and capabilities for efficient inventory management.
Maximum automation of warehouse processes
Ysell.pro maximally automates all aspects of inventory management. The system automatically processes the receipt and shipment of goods, updates inventory levels, and provides accurate information on product availability. This will help reduce labor costs and prevent errors associated with manual data entry.
Efficient management of multiple storage points
The system allows for centralized coordination of all warehouse processes, providing a unified view of inventory levels, product movement, and order fulfillment. Regardless of the location of your storage points, you can efficiently manage all operations from a single account, minimizing the risks of overproduction or product shortages.
Real-time access from any device
The cloud architecture of Ysell.pro ensures instant access to real-time data from any device. You can monitor inventory status, make strategic decisions, and manage warehouse operations at any time from anywhere in the world.
Built-in reports to keep you constantly informed
With Ysell.pro, you also gain the ability to automatically generate reports on inventory status, analyze sales data, and forecast demand based on statistical information. This will help you make informed purchasing decisions, reducing the risks of losing sales due to product shortages or overspending on unnecessary inventory storage.
Do not miss the opportunity to leverage advanced technologies to optimize your warehouse. Try Ysell.pro and experience its effectiveness and advantages for your business.
Frequently Asked Questions
1. How to use spreadsheets for inventory control?
You can use Excel or Google Spreadsheets to control inventory by creating a spreadsheet with columns for product components, quantity, cost, and other necessary information. Regularly update and process data to track inventory levels.
2. What are the advantages of using Excel for inventory control?
Among the advantages are its widespread availability, ease of use, flexibility in customization, as well as the ability to perform calculations, create charts, and generate reports.
3. Are there ready-made spreadsheet templates for inventory management in Excel?
Yes, there is a ready-made inventory spreadsheet template. It includes columns with key metrics and calculations, making the customization process more straightforward.
4. What formulas can I use in Excel to calculate inventory levels?
To calculate inventory levels, you can use formulas such as SUM, FIND, and SORT. For instance, subtracting the total sales volume from the total purchase volume can provide you with the current inventory level.
5. How to create a barcode scanning system in Excel for inventory control?
You can create a simple barcode scanning system by associating each product with a unique identifier. Use Excel for data input and management. If your barcode scanner is compatible, it can directly input information into the Excel spreadsheet.
6. Is there a limit on the number of products I can manage using spreadsheets?
The number of products you can manage in Excel is limited by the capabilities of the program. While Excel can handle a substantial amount of data, for larger inventories, it is advisable to use specialized inventory management software.
7. Can I create reports and analytics using Excel for inventory management?
Yes, Excel is capable of generating reports and analytics. You can use pivot tables, charts, and various formulas to analyze inventory levels, sales trends, and other key indicators for inventory management.